 |
In this clip the teacher uses worksheet 1 to create an opportunity to introduce the meaning of quantities (click for more details).
This is one way of creating an opportunity to define quantities for the semester. It is important for the subsequent modules that students know what is meant by quantities as defined by the text. In this case the teacher created an opportunity to have a discussion with her students about quantities to find out what they know and make sure that it is adjusted so it fits with the working definition for the class.
|
 |
In this clip the teacher initiates a discussion about average speed (click for more details).
The class discusses how average speed can be calculated. They recall the formula that distance equals rate times time and realize they need a certain distance. Since average rate of change is a theme that will continue through the semester, this is an opportunity to being to build a strong understanding as a class. The students realize that a car will speed up and slow down, thus not always going the average speed.
|
 |
In this clip the teacher has a discussion with a group of students about how they are going to calculate their speed (click for more details).
The teacher is going around to the groups while they come up with ways to figure out their speed. She is asking them about how they found their speed and probes for meaning behind why they are doing what they are doing. This is one example of her interaction with a group.
|
 |
In this clip the teacher is leading a recap discussion with the whole class (click for more details).
After having discussions with individual groups the teacher leads a recap discussion with the entire class to point out some important items. Since this is the first worksheet of the class this type of interaction is very important to start developing the appropriate normative behaviors for the semester. She also engages them in thinking about whether or not they ever achieve their average speed.
|
 |
In this clip the teacher is has the class put their graphs on the board to create a class discussion (click for more details).
She creates an opportunity to discuss the similarities and differences between the graphs. This will also allow her to draw the students' attention to aspects of the graphs that are important.
|
 |
In this clip the teacher is continuing the group discussion about the shape of the graph the class created for question 2 (click for more details).
She guides the discussion to be about the shape of the graph and its relationship to speed. The students recognize that steeper means faster with regards to the graph's shape. The teacher negotiates this discussion to be about how to calculate average rate of change for the truck which will help give students the view of average speed as taking the same trip at a constant rate (which is consistent with the view described in the text). She also makes the connection between average speed and slope between the two endpoints.
|
 |
In this clip the teacher is discussing the quantities involved in the problem (click for more details).
She is focusing their attention on the quantities involved in the problem. She is having them decide which ones vary and which do not. She also uses the Explore Box applet in order to help the students imagine the covariation in the problem.
|
 |
In this clip the teacher leads a class discussion about how the groups created their box of maximum volume (click here for more details).
The teacher is allowing the groups to share how they determined they had created the box of maximum volume. One group suggests using a formula, which some groups have not had a chance to attempt yet. The teacher allows the students time to evaluate the suggestion and try to make sense of it.
|
 |
In this clip the teacher is leading a discussion about what the graph of the situation will look like (click here for more details).
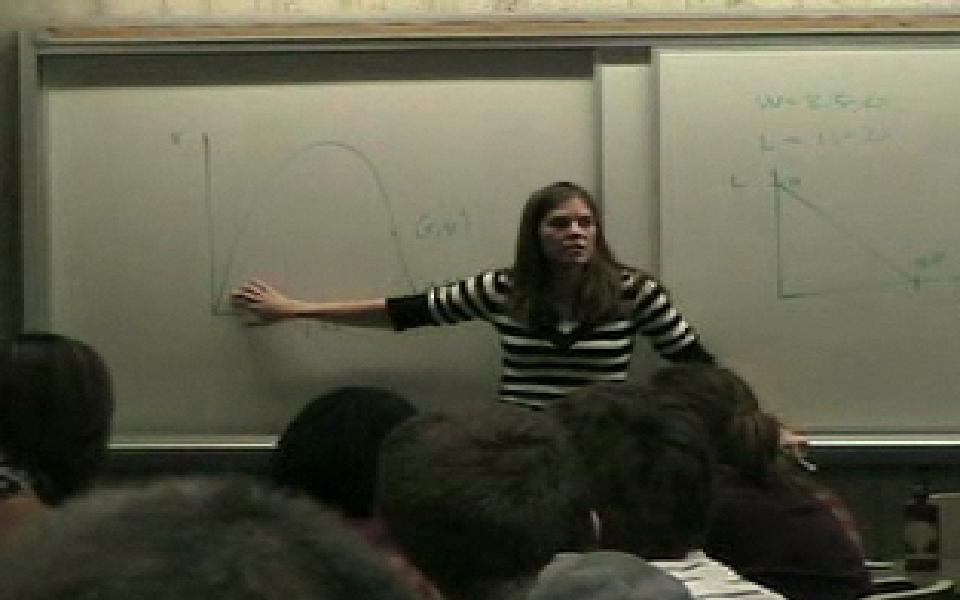
While discussing how to determine whether or not the box created is of maximum volume with the class a student brings up that you can use the graph. Together with the class the teacher creates the graph of the situation. They discuss the reasons why the graph has the shape that it does.
|
 |
In this clip the teacher is leading a discussion about the co-variation between the various quantities of the box problem (click for more details).
The teacher is using a slide which is no longer in the powerpoint, but this is still an example of how the box problem may be summarized in a meaningful way. She gets the students involved in recognizing how pairs of quantities are changing in tandem.
|
 |
In this clip the the teacher asks the students about the relationship between the length of the cutout and the length of the box (click for more details).
This is an example of a class discussion regarding the covariation between two specific quantities. In this example the teacher has the students focus on the direction of the covariation between the two.
|
 |
In this clip the students are unsure whether the length and width of the box co-vary so she has them discuss other the relationships between quantites to help them (click for more details).
The teacher begins by asking them about the covariation between the length of the box and the width of the box. When the students struggle with this, she makes the move to ask them about the covariation of the length of the cutout with the volume of the box and the width of the box with the volume of the box. She uses the students prior knowledge along with the applets to facilitate this discussion.
|
 |
In this clip the teacher is discussing the rate of change and how it is changing with a small group of students (click for more details).
The teacher makes an important distinction about how to talk about a graph that is concave down. She points out a small subtlety in wording that the students need to be aware of in order to meaningfully talk about the situation. This is an opportunity to help students negotiate a normative way of talking about a situation with a changing rate of change so it is important that the teacher is specific about her wording.
|
 |
In this clip the teacher is discussing the rate of change of the volume with respect to the length of the cutout (click for more details).
This is another important point to make when summarizing the box problem. The teacher guides the students as they use the graph to make inferences about the rate of change. She also uses their knowledge from a previous activity to discuss an instantaneous rate of change and how to calculate an average rate of change.
|
 |
In this clip the teacher leads the class in calculating the average rate of change (click for more details).
This may become necessary during the summary if the class appears to be having difficulty recalling how to calculate the average rate of change. Since average rate of change will be a recurring topic throughout the semester, it is important that the students leave the first module with a strong understanding of how to calculate and interpret average rate of change.
|
 |
In this clip the teacher leads a discussion about whether or not there are two boxes that can have the same volume (click for more details).
This is another question a teacher can ask to help summarize the box problem. The students have the opportunity to show an understanding of outputs and inputs and have to co-vary what is happening when given an output.
|
 |
In this clip the teacher leads a discussion about the pros and cons of using the algebraic representation for the box problem (click for more details).
The students contribute positives and negatives of having a formula to represent the box problem. This is a good example of how a teacher can lead such a discussion. The other representations are covered in the next two clips.
|
 |
In this clip the teacher leads a discussion about the pros and cons of using a graph and then a table to respresent the box problem (click for more details).
Continued from the previous clip, the teacher now moves the discussion to be about the graphical representation followed by the tabular representation. Together with the class they discuss the advantages and disadvantages of these two representations. In the following clip they cover the remaining representations.
|
 |
In this clip the teacher leads a discussion about other possible representations for the box problem (click for more details).
As a group they discuss the pros and cons of actually making the box out of paper and discussing the situation in words. This is continued from the previous two clips to show how the teacher ensures all of the representations are discussed.
|

