The investigation supports students in defining functions to model how quantities in a real world context change together. Our and others’ data has repeatedly revealed that students who are able to identify quantities (attributes that can be measured
or take on a numerical values) in a problem context and consider how they change together are able to construct meaningful function formula and interpret the meaning conveyed by function graphs. We continue our emphasis on carefully defining the
variables (e.g., l = the length of the base of the box in inches) in the situation to be related. This is needed to assure that students are clear on exactly what length values are being represented by a particular variable.
The investigation begins by asking students to build a box with specified constraints. This activity helps students visualize the quantities, constraints, and relationships that determine the resulting shape of the box. As students consider where
to make the cut on the paper encourage them to realize that the length of the side of the squares cut from the corner cannot exceed 1⁄2 the length of the shortest side of the paper. Students should realize that when
the sides are folded up, the edges along the cuts become the vertical edges of the box.
-
Consider what is involved in building a box (without a top) from an 8.5” by 11” sheet of paper by cutting squares from each corner and folding up the sides.
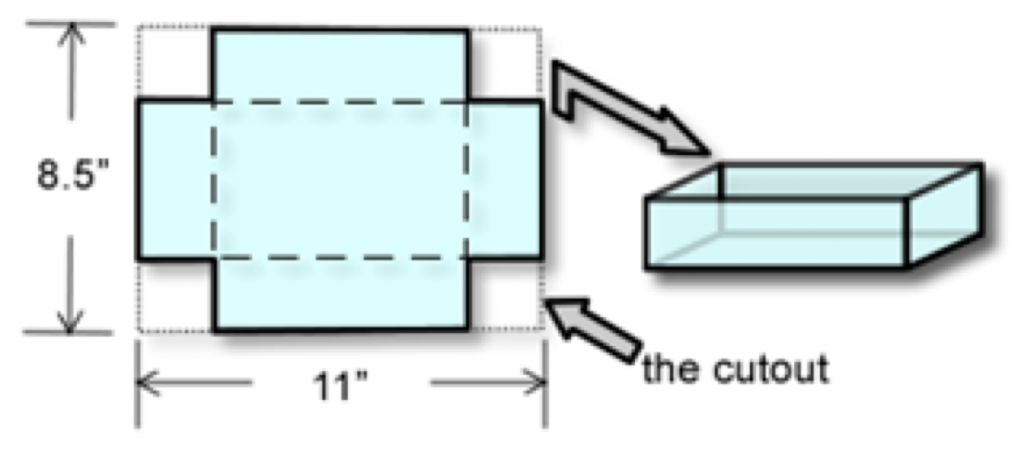
Pass out sheets of paper, scissors, and tape and ask students to create an open-top box by cutting equal-sized squares from the corners of an 8.5 by 11 inch sheet of paper.
- To understand how the quantities in the situation are related we are going to first build a physical model of this situation by:
- Cutting four equal-sized squares from the corners of an 8.5 by 11 inch sheet of paper
- Folding up the sides and taping them together at the edges
-
Do the cutouts have to be square? Explain.
Yes, the cutout must be a square. If it is rectangular, for example, the resulting box will have two different heights (the sides folded up to create the sides of the box will not match up)
-
What quantities in this situation vary? What quantities in the situation are constant (do not vary)?
Use the animation entitled “Box Variation” from the PowerPoint to explore how the quantities in the situation vary. Students should notice that the following quantities vary: the length of the side of the cutout, the length of the base of the box, the width of the base of the box, the volume of the box, the height of the box, the surface area of the box all vary. After posing the above questions while holding a conversation with the animation, students should be able to answer the following questions themselves.
-
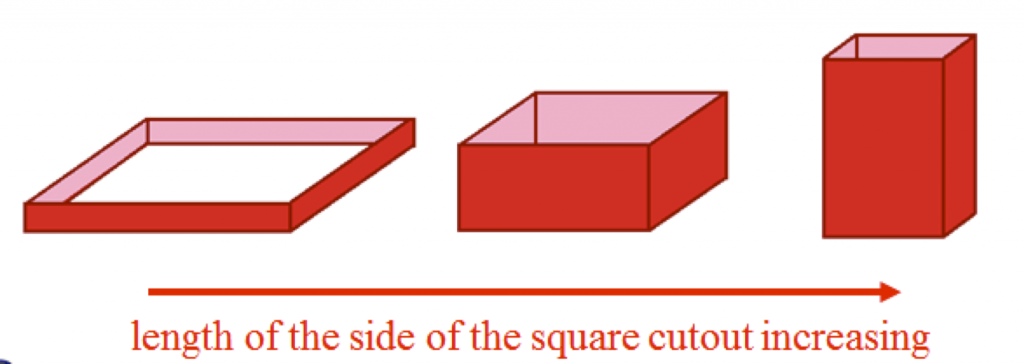
Describe how the configuration of the box changes as the length of the side of the square cutout increases from 0.
Students should notice that the box starts as a flat short box and transforms to a larger volume box (that is more symmetrical) and returns to a tall, skinny box. As the cutout length continues to increase the paper will eventually be folded together.
-
Using the “Volume w/ Cubes” animation, describe how the volume of the box varies as the length of the side of the cutout varies from 0 to 4.25 inches. Recall the formula for the volume of a rectangular solid is V = l×w×h (read volume is equal to length time width time height). Use the animation to discuss why this formula makes sense.
As the length of the side of the cutout varies from 0 to a little less than 2 inches the box’s volume increases, then as the length of the side of the cutout varies from a little less than 2 inches to 4.25 inches the volume of the box decreases and is 0 again when the cutout length is 4.25.
This is a good time to help students conceptualize the difference between linear, square and cubic units. See Cubes Link to help students visualize the meaning of a cubic unit. Out data has revealed that many precalculus students have not yet made a distinction between a square and cubic unit. We can see that the volume is the number of cubic units (or cubes that are 1 inch on each side) that are needed to fill the box.
-
Based on your response to part (e), construct a rough sketch of a graph of the volume of the box f(x) (in cubic inches) in terms of the length of the side of the square cutout x (in inches). (Be sure to label the axes.)
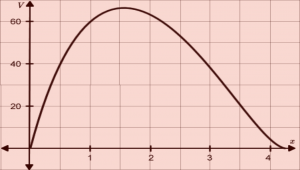
As x increases from 0, f(x) increases up to a point and then as x continues to increase, f(x) decreases to 0.
-
Use a ruler to measure the length of the side of your square cutout (measured in inches), where the length of the base is the side that was originally 11 inches long and the width of the base is the side that was originally 8.5 inches long.
Determine the values of each of these quantities for your box.
- Cutout length: ___________
- Box’s height: ___________
- Length of box’s base: ___________
- Width of the box’s base: ___________
- Volume of the box: ___________
Answers will vary. Consider constructing a table on the board with cutout lengths of 0”, 1,” 1.5”, and 2” and model the process of determining the length, width and volume for 4-5 different shaped boxes that were built by students in the class. Probe students to notice the patterns in the table — e.g., that the length of the base of the box is 11 inches minus 2 times the cutout side length.
- To understand how the quantities in the situation are related we are going to first build a physical model of this situation by:
-
If our goal is to define a function f that determines the varying values of the volume of the box in terms of the length of the sides of the squares cut from each corner.
-
Define variables to represent the varying values of these two quantities.
Let x represent the varying values of side of the squares (in inches) cut from the 4 corners of the paper. Let f(x) represent the varying values of the box’s volume (in cubic inches) (Continue emphasizing that students say exactly what quantity the variable represents.)
-
Complete the following table to determine the dimensions of various quantities in.
You can consider skipping this question or having students complete it in homework; however, if you have some weak students in your class they will benefit from developing the table themselves. Encourage students to generalize the approach they used when determining the values of each quantity.
x = h w l f(x) 0 8.5 11 0 1 6.5 9 58.5 4.25 0 2.5 0 5 impossible — — impossible — 15 — — impossible 12 — -
Since the width, length and height of the box must all be represented in terms of x, use the above table to:
-
define the length of the base of the box in terms of x, the length of the side of the square cutout.
Let x be the length of the side of the cutout (measured in inches)
Let l be the length of the box (measured in inches)
l = 11 − 2x
You can use the “Graphs” animation from the PowerPoint and refer back to the table to explore how the length of the side of the box varies with the cutout length. Students should notice that the length of the box is found by subtracting twice the length of the side of the cutout from the original length of the paper. Pose the question, for any change in the length of the side of the cutout, the length of the side of the paper decreases by 2 times as much. Δl = −2Δx.
-
define the width of the base of the box in terms of x, the length of the side of the square cutout.
Repeat the same process with the “Graphs” animation, selecting “See Width vs cut”.
Let w be the width of the box (measured in inches)
w = 8.5 − 2x
The width of the box is found by subtracting twice the length of the side of the cutout from the original width of the paper. For any change in the length of the side of the cutout, the width of the base of the box decreases by two times as much. Δw = −2Δx.
-
-
Define a function f that determines the volume of the box f(x) in terms of the length of the side of the square cutout x.
Let f(x) be the volume of the box (measured in cubic inches). Since [latex]V = l w h[/latex],
[latex]f(x) = (11-2x)(8.5-2x)x[/latex]
-
Function Notation
Function notation allows us to refer to the value of the function’s output quantity without having to perform the calculus to determine the value. If the function f defines the volume of the box (in cubic inches) in terms of the length of the side of the square cutout (measured in inches), the rule for this function is the expression on the right and represents the volume of the box f(x) in terms of the length of the side of the cutout, x.
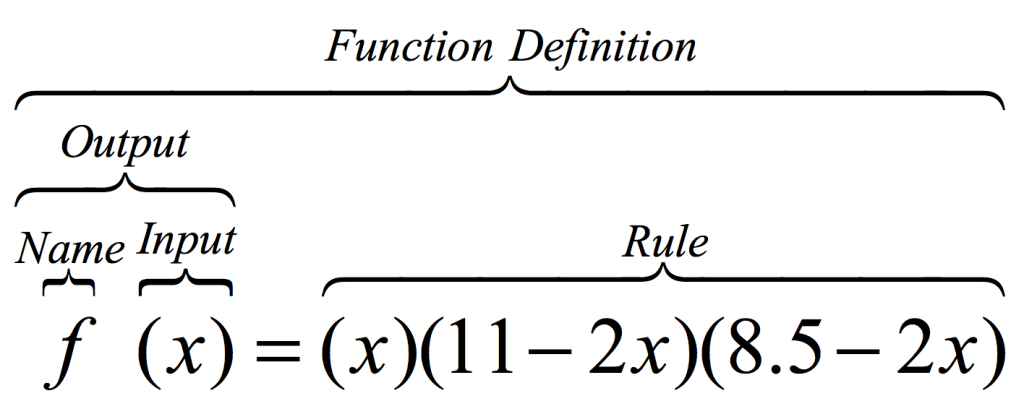
When defining a function formula the convention is to write the name of the function, the input variable inside of parentheses, an equal sign, and then the rule. The rule is an expression on the right of the equal sign that determines values of the output quantity f(x) for specific values of the independent quantity x.
When defining a function to represent the dependent quantity in terms of the independent quantity our goal is to construct an expression (also called a rule) that determines values for the dependent quantity for specific values of the independent quantity. We can also think of the rule as a way of restricting how x and f(x) change together. When given a specific value of the independent quantity, x = c, the corresponding value of the dependent quantity is f(c).
Example: Given that the function f as defined above,
- f(1.5) represents the box’s volume when the length of the side of the cutout is 1.5 inches.
- f(x) represents the varying values of the box’s volume and x represents the varying values of the length of the side of the square cutout. If we substitute 0.5 into x in the function rule we obtain a value of 37.5 cubic units. This is the box’s volume (in cubic units) when the side of the square cutout, x is 0.5 inches. We write f(1.5) = 37.5 to convey that the volume of the box is 37.5 cubic inches when the length of the side of the cutout is 0.5 inches.
-
-
Use your formula from part 2d to represent the volume of the box when x, the length of the side of the cutout, is 0.5 inches.
f(0.5). Point out that function notation allows one to reference a specific output quantity associated with a value of x, without having to determine the actual value of the output quantity.
-
Use your function formula from 2d to represent the volume of the box when x, the length of the side of the cutout, is 3 inches. Then determine the box’s volume when x = 3.
f(3) = 37.5. Again, point out function notation can be used to represent the volume of the box for a specific value of x, without actually computing the value.
-
What is the smallest possible value for x, the length of the side of the square cutout?
It is also important to probe students to consider the minimum value of the length of the side of the cutout. Some students may argue that the minimum cut is 0 inches, while others may argue that it is just larger than zero since you cannot make a box with no height. Let students justify their reasoning and come to a decision as a class as to whether to include 0 (and later 4.25) in the domain of the function. Make sure that students mention units when writing answers. 0 (or just bigger than 0)
-
What is the largest possible value for x, the length of the side of the square cutout?
4.25 (or just smaller than)
-
The values that the independent variable can assume is called the function’s domain. What is the domain of f?
0 < x < 4.25 or 0 ≤ x ≤ 4.25 depending on whether or not one decides that a box can have a volume of 0. Some students may write the answer using set notation (0, 4.25) or [0, 4.25]. Point out that these are two different ways of representing the continuum of real number values between 0 and 4.25
-
Question 4 probes students to understand and articulate the meanings that are conveyed by the function’s graph. Ask students to articulate the meaning of a point on the graph. They should view the horizontal distance of a point from the vertical-axis as representing the cutout length, and the vertical distance from the horizontal-axis representing the value of the volume of the box that corresponds to this cutout length.
-
-
View the “Graphs” animation (or use your graphing calculator) to create a graph that represents the volume of the box f(x) (measured in cubic inches) in terms of the length of the side of the square cutout x (measured in inches).When determining the window setting on your calculator, consider the possible values of x and the possible values of f(x).) Construct the graph and label two points on the graph, then describe what each point represents.

-
Point 1:
Students will pick various points. Be sure to press them to explain what the coordinates mean in the context of the problem. Ask them what distance on the graph represents the box’s volume and what distance represents the side length of the square cut from the four corners.
-
Point 2:
-
-
Identify the point on the graph that corresponds to the dimensions of your box.
Students should locate the value on the x-axis that corresponds to the side-length of the square they cut; then determine the corresponding f(x) or volume value that corresponds to the volume of their box.
-
Evaluate f(2) and say what your answer represents.
[latex] \begin{align} f(2) &= (11-2(2))(8.5-2(2))(2) \\ &= (7)(4.5)(2) \\ &= 63. \end{align} [/latex]
The volume of the box when the length of the side of the square cutout is x = 2 is 63 cubic inches.
-
As x (the length of the side of the cutout) increases from 0.5 to 0.75 inches, how does the volume of the box change?
The volume of the box increases from 37.5 cubic inches to 49.88 cubic inches. Prompt students to point to the lengths on the graph that represent these changes. Ask students if the volume of the box is always increasing on this interval.
-
As x (the length of the side of the cutout) increases from 2.1 to 2.7 inches, how does the volume of the box change?
The volume of the box decreases from 61.404 cubic inches to 46.872 cubic inches. Ask students to determine if the volume of the box is always decreasing on this interval.
-
As x (the length of the side of the cutout) increases from 1 to 3 inches, how does the volume of the box change?
The volume of the box decreases from 52.5 cubic inches to 46.5 cubic inches. Ask students to determine if the volume of the box is always decreasing on this interval. Students should recognize that if we imagine x continuously varying from 1 to 3 inches (despite physical limitations of cutting and constructing a box), then the volume of the box increases on the interval from x = 1 to x ≈ 1.585 and then decreases on the interval from x ≈ 1.585 to x = 3, for a total change in volume of −6 cubic inches.
-
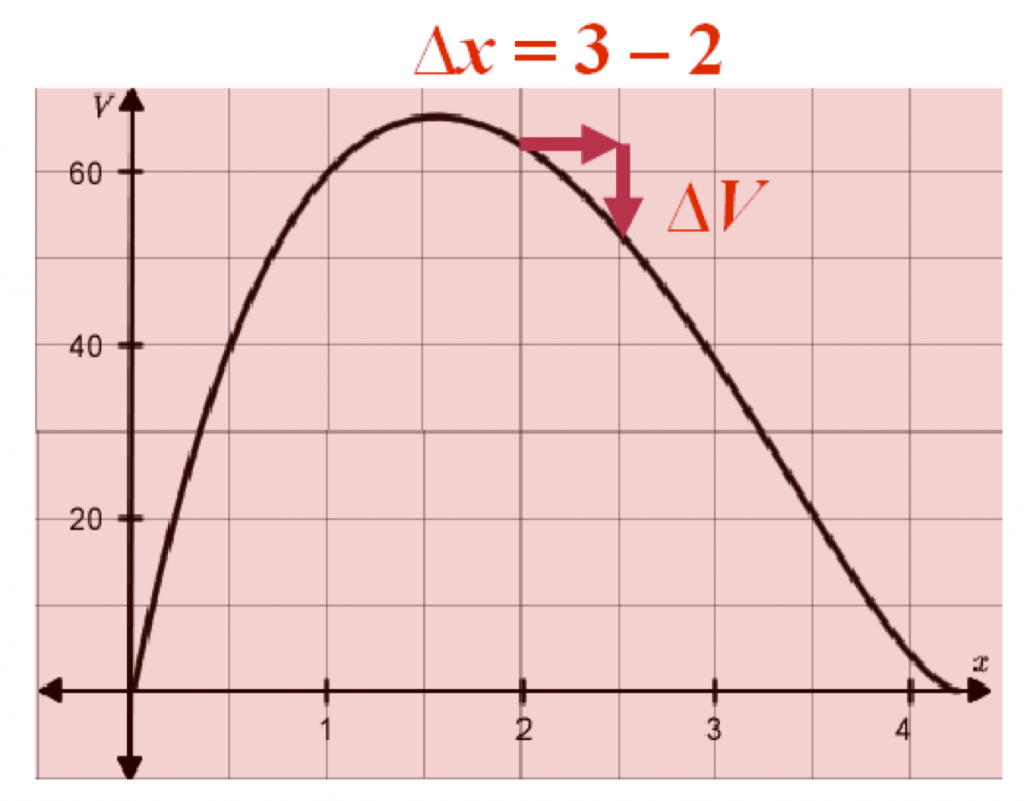
Indicate on the graph, a change of cutout length from 2 inches to 3 inches. Indicate on the graph the length that corresponds to the amount the volume changes when the cutout length increases from 2 inches to 3 inches.
Consider introducing the notation Δx = 3 − 2. Make sure students point to the horizontal and vertical lengths that correspond to these changes.
-
Estimate the interval(s) of values for the length of the side of the cutout x for which the volume of the box decreases.
1.585 ≤ x ≤ 4.25 or [1.585, 4.25]
While discussing this next task (Question 5), encourage students to build a table or explore on the graph (by zooming in) to develop better and better approximations for the maximum volume of a box. Probe students to discuss whether it is possible to locate the exact volume that corresponds to the box’s maximum volume.
(Some students may suggest using the ‘calculate max’ command on their graphing calculator. You could have a class discussion about how the calculator determines this value)
-
-
Using a graphing calculator, determine the following:
-
An approximate value for the maximum value of the box.
The approximate value for the volume of the box is 66.15 cubic inches.
-
The length of the side of the square cutout when the box has maximum volume.
x = 1.585 inches (Encourage students to identify this location on their graph from above)
-
The length of the side of the square cutout when the volume of the box is 25 cubic inches.
The volume of the box is 25 cubic inches when x = 0.305 inches and x = 3.378 inches. These values can be found using a calculator. 25 cubic inches is represented on the graph where the vertical distance from the x-axis represents a volume of 25 cubic inches. The side of the square cutout is determined by finding the value(s) on the x-axis that correspond with an output value of 25.
-
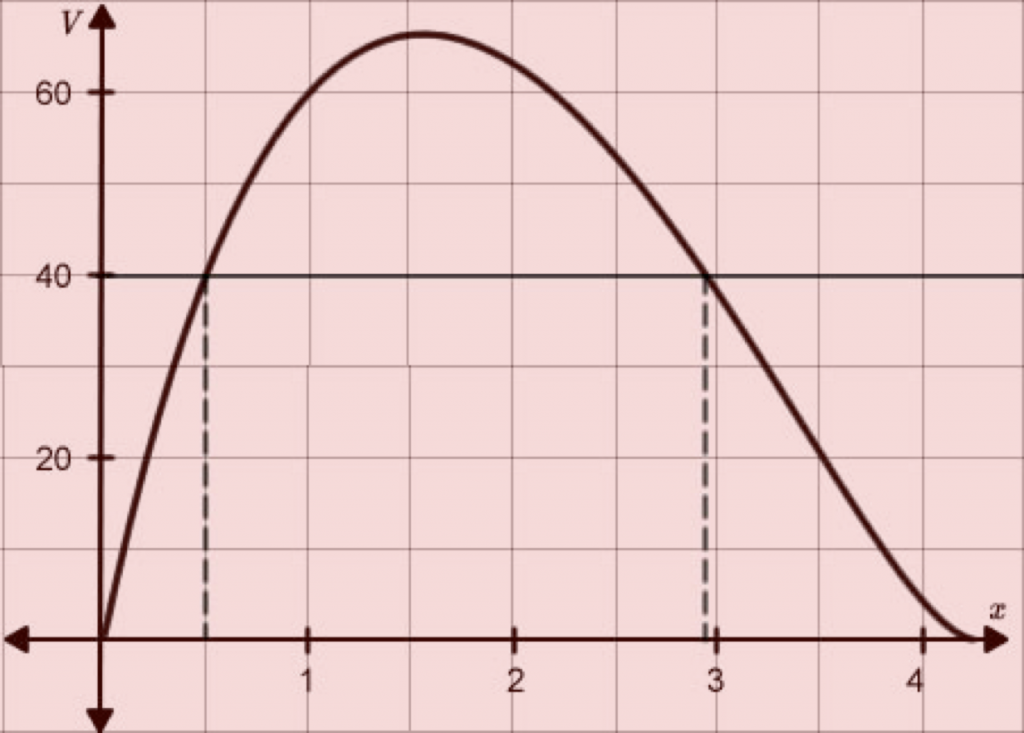
Solve f(x) = 40 and say what the solution(s) represent.
Using the graph we see that f(x) = 40 when x = 0.5 and x = 2.9. Point out to students that solving this equation involves reversing the function process—one is given the value of 40 for the output quantity and determines the corresponding value(s) of the independent quantity. The values of x = 0.5 and x = 2.9 represents the values of the length of the side of the cutout that correspond to a box that has a volume of 40 cubic units.
-
-
Let x represent the length (in inches) of a side of a square and let A represent the area of the square in square inches, so that A = x2. Expand each expression if possible and describe what the expression represents.
-
[latex]3x^2[/latex] The area of 3 squares with side lengths x or 3 times as large as the area of a square with side length x.
-
[latex]\left(3x\right)^2[/latex] [latex]=9x^2[/latex]. The area of a square that has a side length that is 3 times as large as x. This is equal to the area of a square that is 9 times as large of the area of a square that has a side length of x
-
[latex] \left( x + 3 \right)^2 [/latex] [latex]= x^2 + 6x + 9[/latex]. The area of a square (x + 3).
-
[latex] \frac{x}{4} [/latex] 1/4th the length of the side of the square x.
-
[latex] \left( \frac{x}{4} \right)^2 [/latex] [latex] = \frac{x^2}{16} [/latex]. The area of a square whose side are 1/4th the length of x.
-
[latex] x^2 – \left( \frac{1}{3} x\right)^2 [/latex] The difference in the area of a square whose side length are x and the area of a square whose side lengths are 1/33rd the length of x. How much greater the area of a square with side length x is than the area of a square with side length x/3.
-
-
Simplify the following expressions
-
[latex] -3x + 7 – (4-x) [/latex] [latex]= -3x+7 – 4+x = -2x+3 [/latex]
-
[latex] 2.5x -3(-5x-10)[/latex] [latex] =2.5x +15x +30 = 17.5x+30 [/latex]
-
[latex] \frac{3}{4}x + \frac{1}{2}x\cdot x\cdot x – 5\frac{1}{4} x [/latex]
[latex] \begin{align} &= \frac{3}{4}x + \frac{1}{2} x^3 – \frac{5}{4}x \\ &= -\frac{2}{4}x + \frac{1}{2} x^3 \\ &= -\frac{1}{2} x + \frac{1}{2} x^3 \end{align} [/latex]
-
-
-
Simplify [latex] 5(3x)^2 – 7(x)^2[/latex]
[latex] \begin{align} &= 5\left(9x^2\right) – 7x^2 \\ &= 45x^2 – 7x^2 \\ &= 38x^2 \end{align} [/latex]
-
Simplify [latex] \left(\frac{x}{8}\right)^2 – 3(-2x+5) [/latex] [latex] = \frac{x^2}{25} + 6x – 15 [/latex]
-
-
Evaluate each of the following:
-
[latex]f(7)[/latex] when [latex]f(x) = \frac{x^2+(-2+x)}{7x-8} [/latex]
[latex] f(7) = \frac{7^2 + (-2+7)}{7(7)-8} = \frac{54}{41} \approx 1.3171 [/latex]
-
[latex]f(x+2)[/latex] when [latex]f(x) = 2x^2+8x – 12[/latex].
[latex] f(x+2) = 2(x+2)^2 + 8(x+2) – 12[/latex]
-
